We have researched traffic jam prediction and avoidance based on measurable partial information.
To achieve this goal, modeling issues are very important. Traditionally, this was done under assumptions such as explicitly defining statistical independence and distribution to enable analysis in mathematics. However, it is often difficult in practice to confirm and use those assumptions. Therefore, I am thinking of developing queuing theory using only what can be observed without assuming the shape and statistical independence of the distribution.
Such problems can be more broadly interpreted as problems in forecasting time series data. In particular, the problem of identifying signs and causes of events and identifying factors that control events that are rarely required can only be achieved using actual data.
The methodology could be a combination of machine learning and statistical techniques.
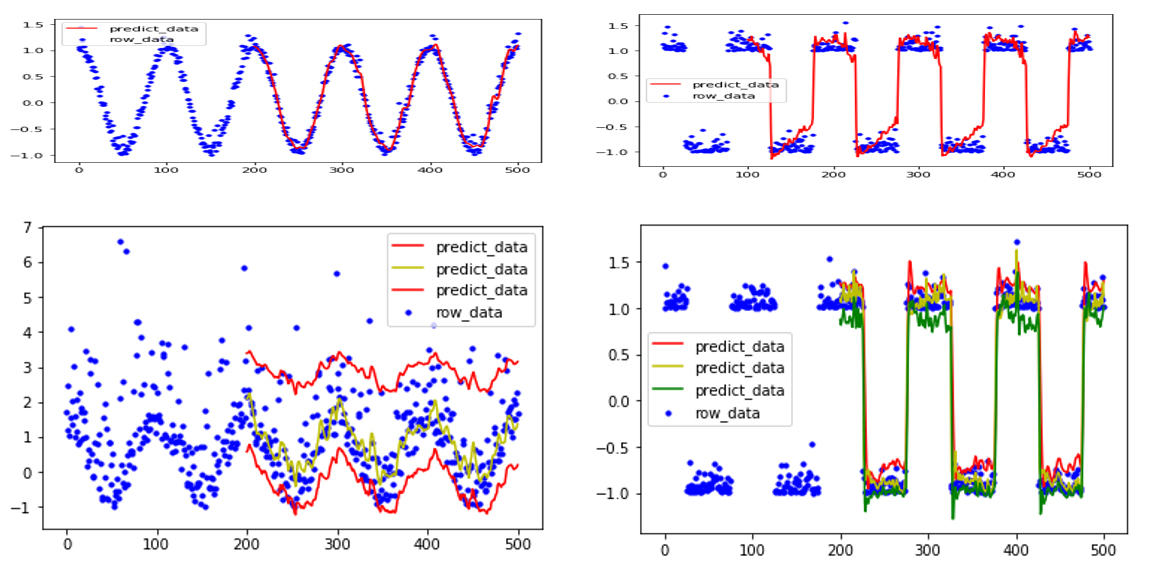
In the figure below, the blue dots are machine learning the cosine function plus noise (left) or the function that takes either -1,1 alternately plus noise (right), and the red line is I predict. In addition to point estimation (top), section estimation (bottom) is also possible.
The above figure uses the LSTM model. The figure below is realized by the method of deep quantile regression with a small change of the LSTM program.
Predictive analysis, extension to spatio-temporal series data, and analysis of extreme confidence levels (tails of distribution) are still problematic and need to be resolved.