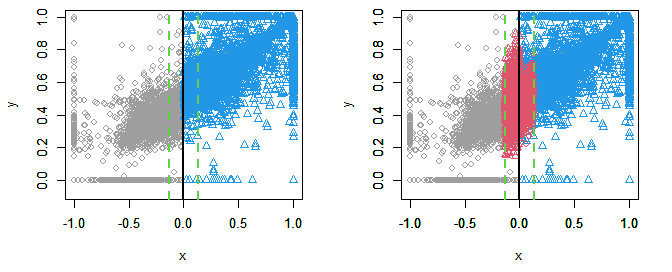
Figure 1: Observed Data (Left) and Simulation of Potential Outcomes (Right)
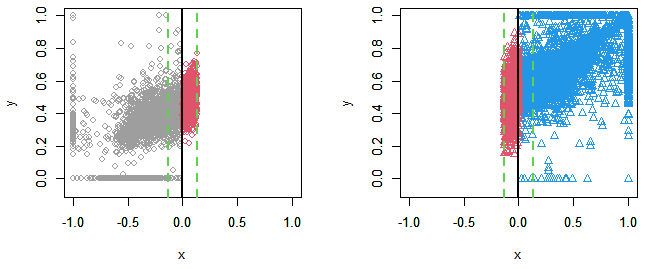
Figure 2: Observed Data and Simulation in the Non-Treated Group (Left), and Observed Data and Simulation in the Treated Group (Right)
■Legends:
Vertical line in black: Cutoff
Vertical dashed line in green: Local area
○ in gray: Observations in the non-treated group
△ in blue: Observations in the treated group
○ in red: Simulated values in the non-treated group
△ in red: Simulated values in the treated group